Right now, as of January 30, 2026, we're tracking 109 active VP Sales, CRO, and executive sales leadership roles. That number alone doesn't tell you much. The context does.
The CRO Report tracks 1,349+ executive sales postings weekly. In 2026, VP Sales remains the most in-demand title, representing 46% of all senior sales leadership openings.
December was brutal. The holiday lull dropped active postings to 66 roles. That's the lowest we'd seen in our tracking window. Companies weren't hiring, weren't posting, weren't doing much of anything on the talent front. Normal seasonal behavior, but still a grim number to stare at for a few weeks.
Then January happened.
The week of January 7, the market snapped back to 118 active roles. A 79% jump in a single week. By January 22, we hit 164, which is the largest active count in recent memory and matches the 2022 all-time high of 162. Last week the count held at 164, up 20% from 137 the week prior. Q1 budgets unlocked, headcount plans got approved, and talent acquisition teams started executing.
This week's drop to 109 is worth watching. Some of it is natural churn as roles fill. Some may be a brief pause after the January surge. We'll know more in the next couple of weeks.
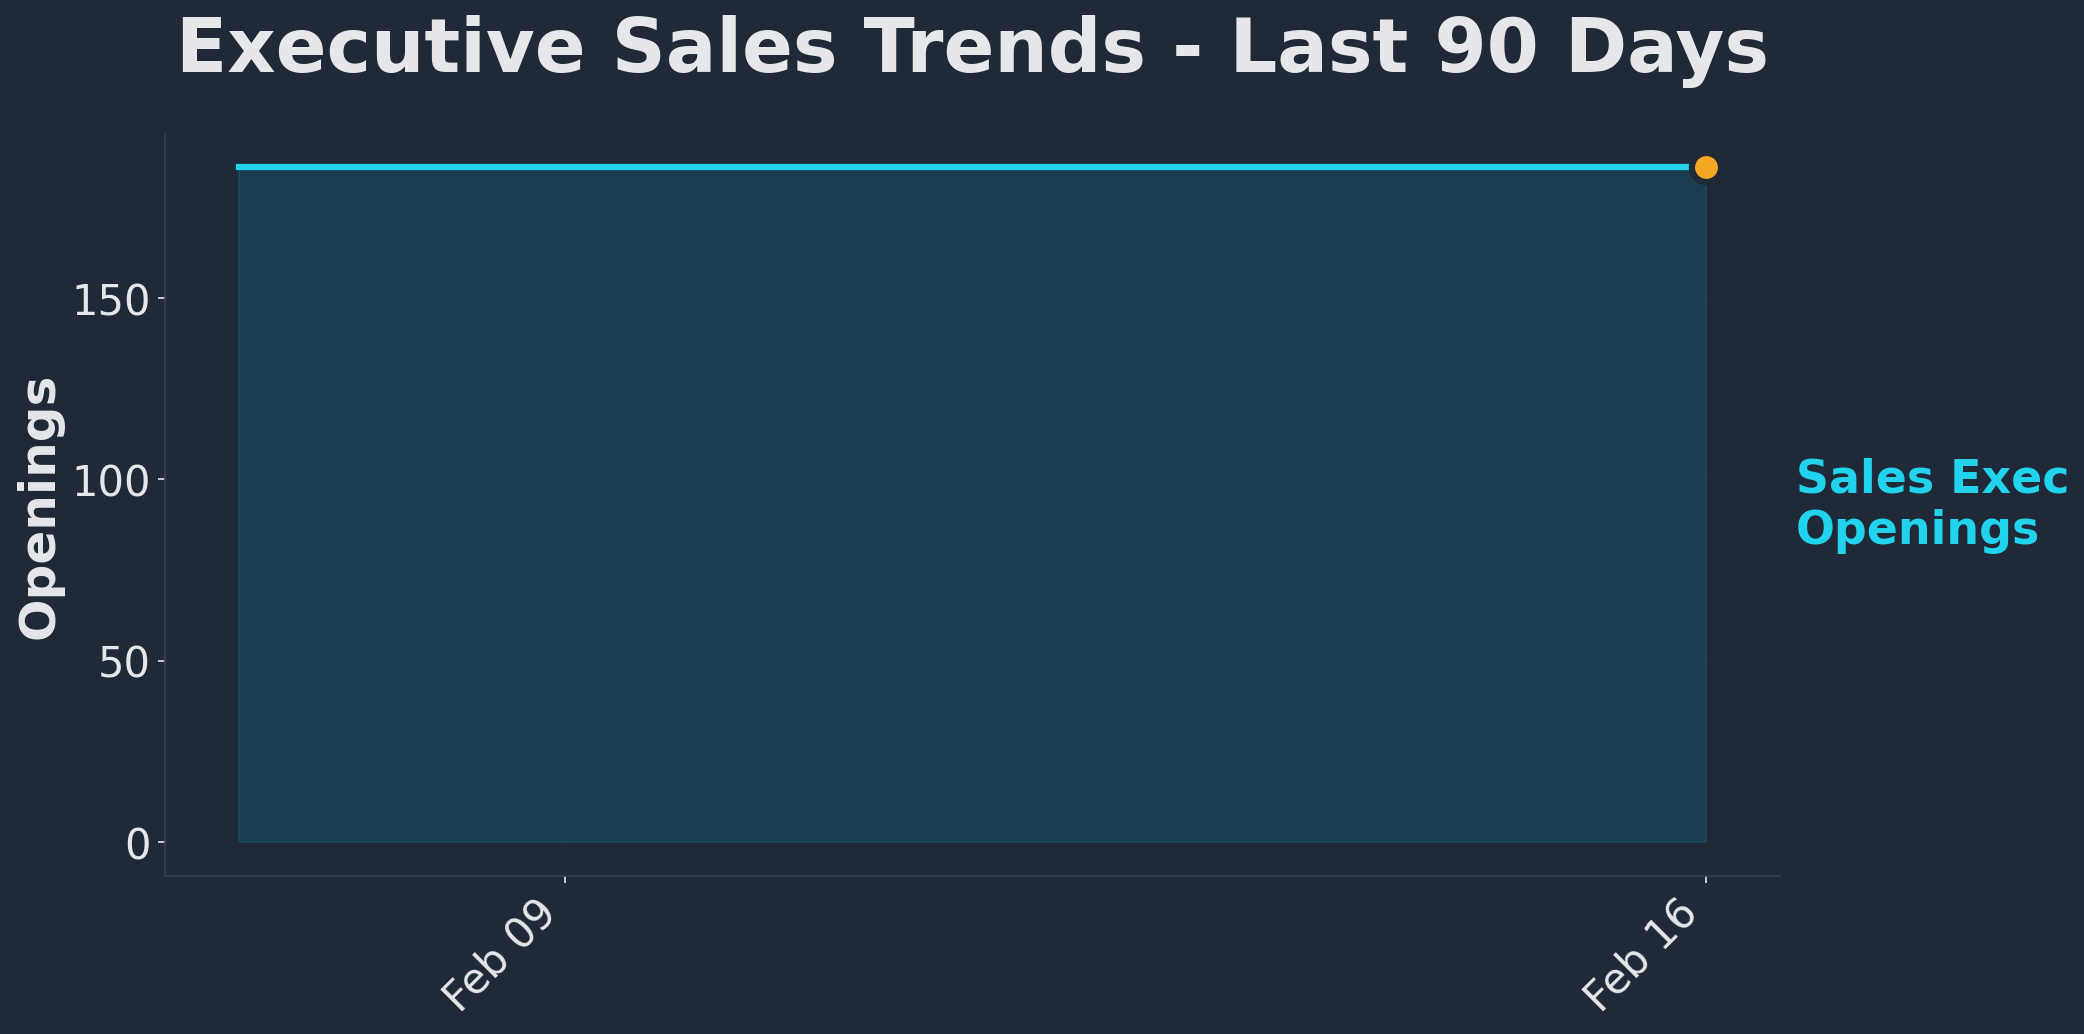
90-day trend: Executive sales roles tracked weekly by The CRO Report. The December dip and January surge are clearly visible.
The 5-Year View
Pull back the lens and the story gets more interesting.
The 2022 peak of 162 active openings was the high-water mark for executive sales hiring. That was the tail end of the zero-interest-rate hiring spree. Every Series B was building out a sales org. Demand for VP Sales leaders was at its loudest.
Then the contraction hit. 2023 brought layoffs, budget freezes, and a market correction that crushed hiring across the board. The sales leadership market didn't escape it. We saw steady declines through 2023 and into 2024, with the market settling into a 100-110 range through most of 2025. Not terrible, not great. Just flat.
The January 2026 surge that pushed us to 164 is significant because it's the first time we've touched 2022 levels. Whether that holds, or whether it was a compressed Q1 budget dump that fades, is the question worth tracking.
What the long view does confirm: the executive sales hiring market is cyclical. It follows macro sentiment, funding cycles, and fiscal year planning. If you're looking for a VP Sales or CRO role, timing matters more than most people acknowledge.
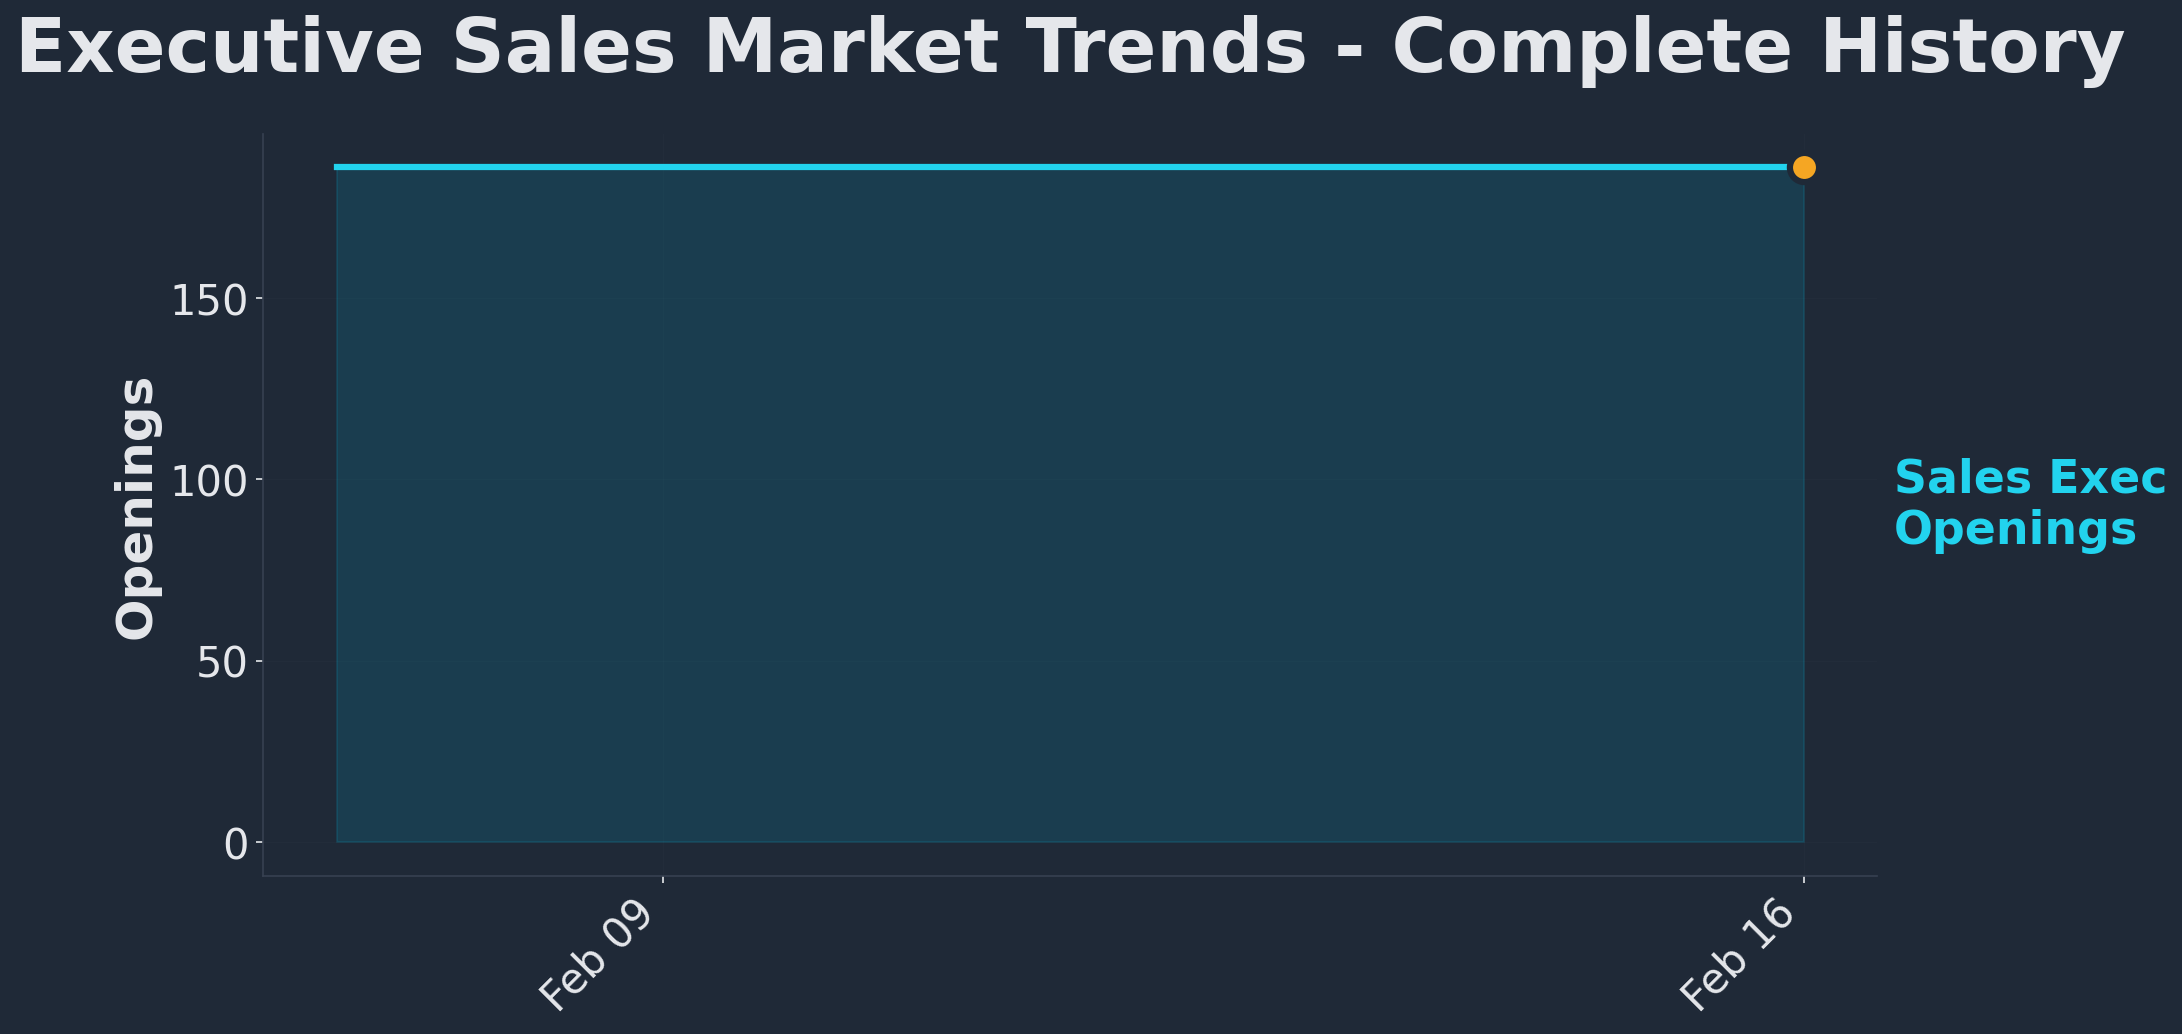
Complete history: Executive sales market trends since tracking began. The 2022 peak, the contraction, and the 2026 rebound are all visible.
Where the Roles Are
We tag every posting by industry. Here's what 1,349 postings have looked like across sectors.
Healthcare
720
Technology / Software
719
Education
626
Financial Services
589
Government
423
Healthcare and tech are essentially tied at the top. That's not new, but the Healthcare number has been quietly climbing. Aging population, digital health expansion, and a wave of health-tech companies all need revenue leaders who understand complex sales cycles and compliance-heavy environments. If you've spent your career in pure SaaS and haven't considered healthcare adjacencies, you're leaving options on the table.
Education at 626 is the surprise of the dataset. EdTech funding has been lumpy, but the sector keeps posting VP Sales roles. Government at 423 is steady, driven by GovTech vendors and defense-adjacent companies that need enterprise sales leadership with clearance experience or public-sector fluency.
The seniority mix across all postings skews heavily toward VP-level titles at roughly 89% of roles. C-level positions (CRO, CSO) make up about 8%, and SVP roles account for around 3%. If you're a VP looking to jump to CRO, the math is clear: there just aren't that many seats.
Remote vs. On-Site
As of this week, 43.9% of active executive sales roles are listed as remote. That's been a fairly stable number through 2025, hovering in the 40-50% range most weeks. Some weeks have pushed past 60%.
The comp gap between remote and on-site is real but not as dramatic as you might expect. Remote roles are posting salary ranges of $151,533 to $217,341, while on-site roles (which tend to concentrate in expensive metros) range from $169,077 to $250,238. Call it roughly a 14% premium for on-site when you compare the high ends.
But that comparison is noisy. On-site roles disproportionately sit in New York, San Francisco, and Boston, where cost of living pushes compensation up regardless of remote policy. A remote role at a Series C company in healthcare-tech might pay just as well as an on-site role at a smaller firm in a secondary market. Context always beats averages.
The trend line is toward more remote flexibility. That's been true since 2020 and nothing we see in the data suggests it's reversing. If anything, companies that insist on fully on-site for a VP Sales role are narrowing their candidate pool at a time when talent is already hard to find. Browse the latest remote openings on our jobs board to see what's available.
Salary Transparency Trends
Across the full dataset, 54.8% of postings disclose some form of compensation range. That's up meaningfully from where we started tracking. Some recent weeks have hit 72.3% disclosure.
Here's the weekly data.
Week
Roles
Avg Max Comp
Disclosure %
2025-W48
232
$252,819
50.1%
2025-W49
96
$241,959
64.9%
2025-W50
47
$242,002
45.2%
2025-W51
97
$310,773
63.8%
2026-W00
22
$183,345
38.6%
2026-W01
73
$235,820
72.3%
2026-W02
89
$253,500
65.9%
2026-W03
37
$249,626
23.3%
2026-W04
11
$227,177
36.7%
The upward trend is real, though it's not linear. State transparency laws in Colorado, New York, California, and Washington continue to push disclosure rates up. Companies posting in those states don't have a choice. But we're also seeing voluntary disclosure increase among companies in states that don't require it. That's a talent market signal: employers know that candidates skip postings without comp data.
For candidates, the practical takeaway is simple. If a company won't disclose a range for a VP Sales role, you're probably looking at below-market comp or a compensation structure that's unusually variable. Companies that feel confident in their offer put it in the posting. Our salary benchmarks can help you calibrate expectations by title, location, and company stage.
The Compensation Trend
Average maximum base compensation across tracked postings has moved from $252,819 in week 48 of 2025 to $227,177 in the most recent partial week. That's a 10.1% decline over roughly nine weeks.
Is this a real market decline? Maybe. But probably not entirely.
A few factors are muddying the numbers. First, the holiday-week data (W00, with just 22 roles) dragged the average down significantly. Small sample sizes produce volatile averages. Second, the mix of roles matters enormously. A week heavy on enterprise SaaS CRO roles in San Francisco will show a very different average than a week heavy on VP Sales roles at mid-market healthcare companies. The underlying comp for equivalent roles hasn't dropped the way the topline number suggests.
That said, a couple of patterns are worth noting. The $310,773 average in W51 was the outlier on the high side, likely driven by a cluster of large-enterprise or late-stage postings that week. The more recent weeks in the $227K-$254K range are closer to what we'd consider a stable baseline for this role tier. You can see how compensation varies dramatically by location in our detailed salary analysis.
The broader context: The current average max compensation of $280K across all active roles (which includes equity-heavy comp packages at some companies) is healthy by historical standards. The week-to-week fluctuations in the disclosed-salary averages tell you more about posting mix than about market direction. If you're benchmarking comp for a specific role, filter by seniority, location, and company stage. The aggregate number is a starting point, not a conclusion.
What This Means
If you're currently employed
The January surge means your market value just went up. More open roles means more leverage, even if you're not actively looking. Use the data to benchmark your current comp and know what you're worth. Start with our salary benchmarks.
If you're job seeking
Q1 is your window. The January rebound is real and historically the strongest hiring period for executive sales roles. The market won't stay this hot through Q2. Move now, be selective, and use disclosure data to filter out roles that won't pay what you're worth.
If you're a hiring company
You're competing with 109 other open roles for the same candidate pool. Disclose comp ranges. Offer remote flexibility. Be specific about the role and growth trajectory. Vague postings sit unfilled while transparent ones close fast. Check what your competitors are offering on our active jobs board.
Methodology
How We Collect This Data
Every week, we scrape and ingest executive sales job postings from across major job boards, company career pages, and aggregators. We're looking specifically for VP Sales, SVP Sales, CRO, CSO, and equivalent titles. Manager-level and director-level roles are excluded.
Each posting goes through an enrichment pipeline: we extract and normalize compensation data, location/remote status, industry, seniority level, and company metadata. Duplicate postings (same company, same role, different boards) are deduplicated so each role is counted once.
The dataset began accumulating in January 2025. We've tracked 1,349 unique postings through January 30, 2026, with 109 currently active. "Active" means the posting is still live and hasn't been marked as filled or removed.
Compensation data is based on disclosed salary ranges only. When a posting doesn't include comp, it's excluded from compensation averages but still counted in volume and trend data. This means our comp figures skew toward companies that are transparent about pay, which may bias the averages slightly higher than the true market.
This page is updated monthly with fresh analysis. For weekly updates with real-time commentary, subscribe to our newsletter.
Frequently Asked Questions
As of January 30, 2026, we're tracking 109 active VP Sales, CRO, and executive sales roles. This number fluctuates weekly. The recent peak was 164 roles on January 22, 2026, following a holiday lull that bottomed at 66. You can browse all current openings on our jobs board.
The average maximum disclosed base compensation across our tracked postings is $280,000. Weekly averages have ranged from $183K to $311K depending on the role mix and disclosure rates that week. Compensation varies significantly by location and company stage. See our VP Sales salary deep-dive for breakdowns by city, seniority, and funding stage.
Currently 43.9% of tracked postings are listed as remote. Some weeks have exceeded 60%. Remote roles tend to pay roughly 14% less at the high end compared to on-site roles, though that gap is influenced by geographic concentration of on-site roles in expensive metros like New York and San Francisco.
Yes, by the numbers. The market contracted through 2023-2024 and plateaued around 100-110 active roles for most of 2025. January 2026 brought a significant rebound, with active roles hitting 164 and matching the 2022 all-time high. Whether this sustains through Q2 or was a compressed Q1 budget cycle is what we're watching now.
Healthcare (720 mentions) and Technology/Software (719) are virtually tied. Education (626) and Financial Services (589) are close behind. Government rounds out the top five at 423. The Healthcare number has been trending up, driven by digital health expansion and health-tech funding. See our full market intelligence for more detailed industry analysis.
This page is refreshed monthly with the latest trends and analysis. For weekly updates delivered to your inbox, subscribe to our newsletter. The underlying dataset is built from weekly scraping, enrichment, and deduplication of executive sales job postings across the web.
Get Weekly Market Updates
This page updates monthly. The newsletter ships every Thursday with real-time data, executive moves, and roles worth your time.
Disclosure: The CRO Report is an independent market intelligence platform. We are not a recruiting firm and do not receive placement fees. Data is collected from publicly available job postings and processed through our proprietary enrichment pipeline. Compensation figures reflect disclosed ranges only and may not represent total compensation including equity, bonuses, or other benefits. Individual outcomes will vary.
About the author: Rome Thorndike is VP Revenue at Firmograph.ai and the founder of The CRO Report. He has 15+ years in B2B sales leadership at Salesforce, Microsoft, Snapdocs, and Datajoy (acquired by Databricks). MBA from UC Berkeley Haas.
Last updated: January 30, 2026. Next scheduled update: February 2026.